Originating in 18th-century Japanese rice markets through legendary trader Munehisa Homma, candlestick charts remain the most intuitive and powerful visualization of buyer and seller psychology in modern capital markets.
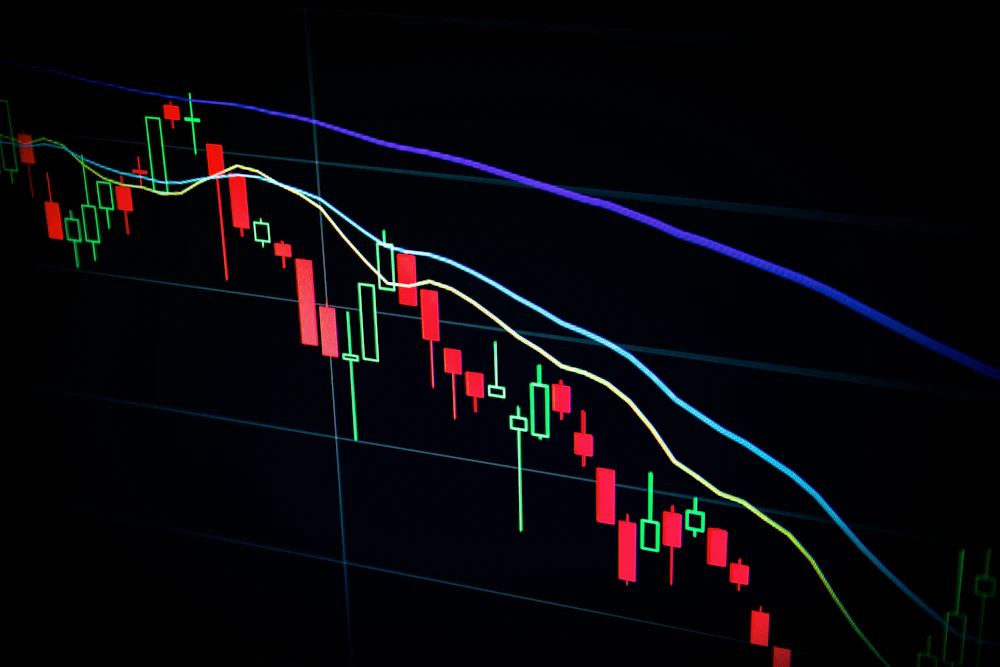
Anatomy of a Candlestick: Open, High, Low, Close (OHLC)
Each candle tells a story of auction dynamics over a specified timeframe:
- The Real Body: Represents the price distance between the Open and Close. A green body signals buyers dominated the session, while red signals aggressive seller liquidation.
- The Upper Wick (Shadow): The highest price reached during the period. Long upper wicks indicate that buyers attempted to push higher but were rejected by supply.
- The Lower Wick: The lowest price reached. Long lower wicks (e.g. Hammer patterns) signal that sellers drove prices down, but institutional dip-buyers absorbed all liquidity.
The Golden Rule: Never Trade a Candlestick in Isolation
A hammer or bullish engulfing candle on random noise is meaningless. The same pattern forming precisely at an established horizontal support level with a surging volume histogram provides an institutional high-probability setup.

3 Essential Indicators Every Beginner Should Master
- 20-Day and 50-Day Exponential Moving Averages (EMA): Dynamic trend filters. When price trades above the 20 EMA, the short-term momentum is bullish.
- Relative Strength Index (RSI): A momentum oscillator ranging between 0 and 100. Readings above 70 indicate overbought conditions, while readings below 30 indicate oversold territories. Look for RSI divergences where price makes a lower low but RSI forms a higher low.
- Volume Weighted Average Price (VWAP): The benchmark price institutional algorithms use to execute large block orders without slippage.